Inspired by Anthropic’s concept, TypingMind Artifacts are designed to seamlessly integrate with your existing workflow.
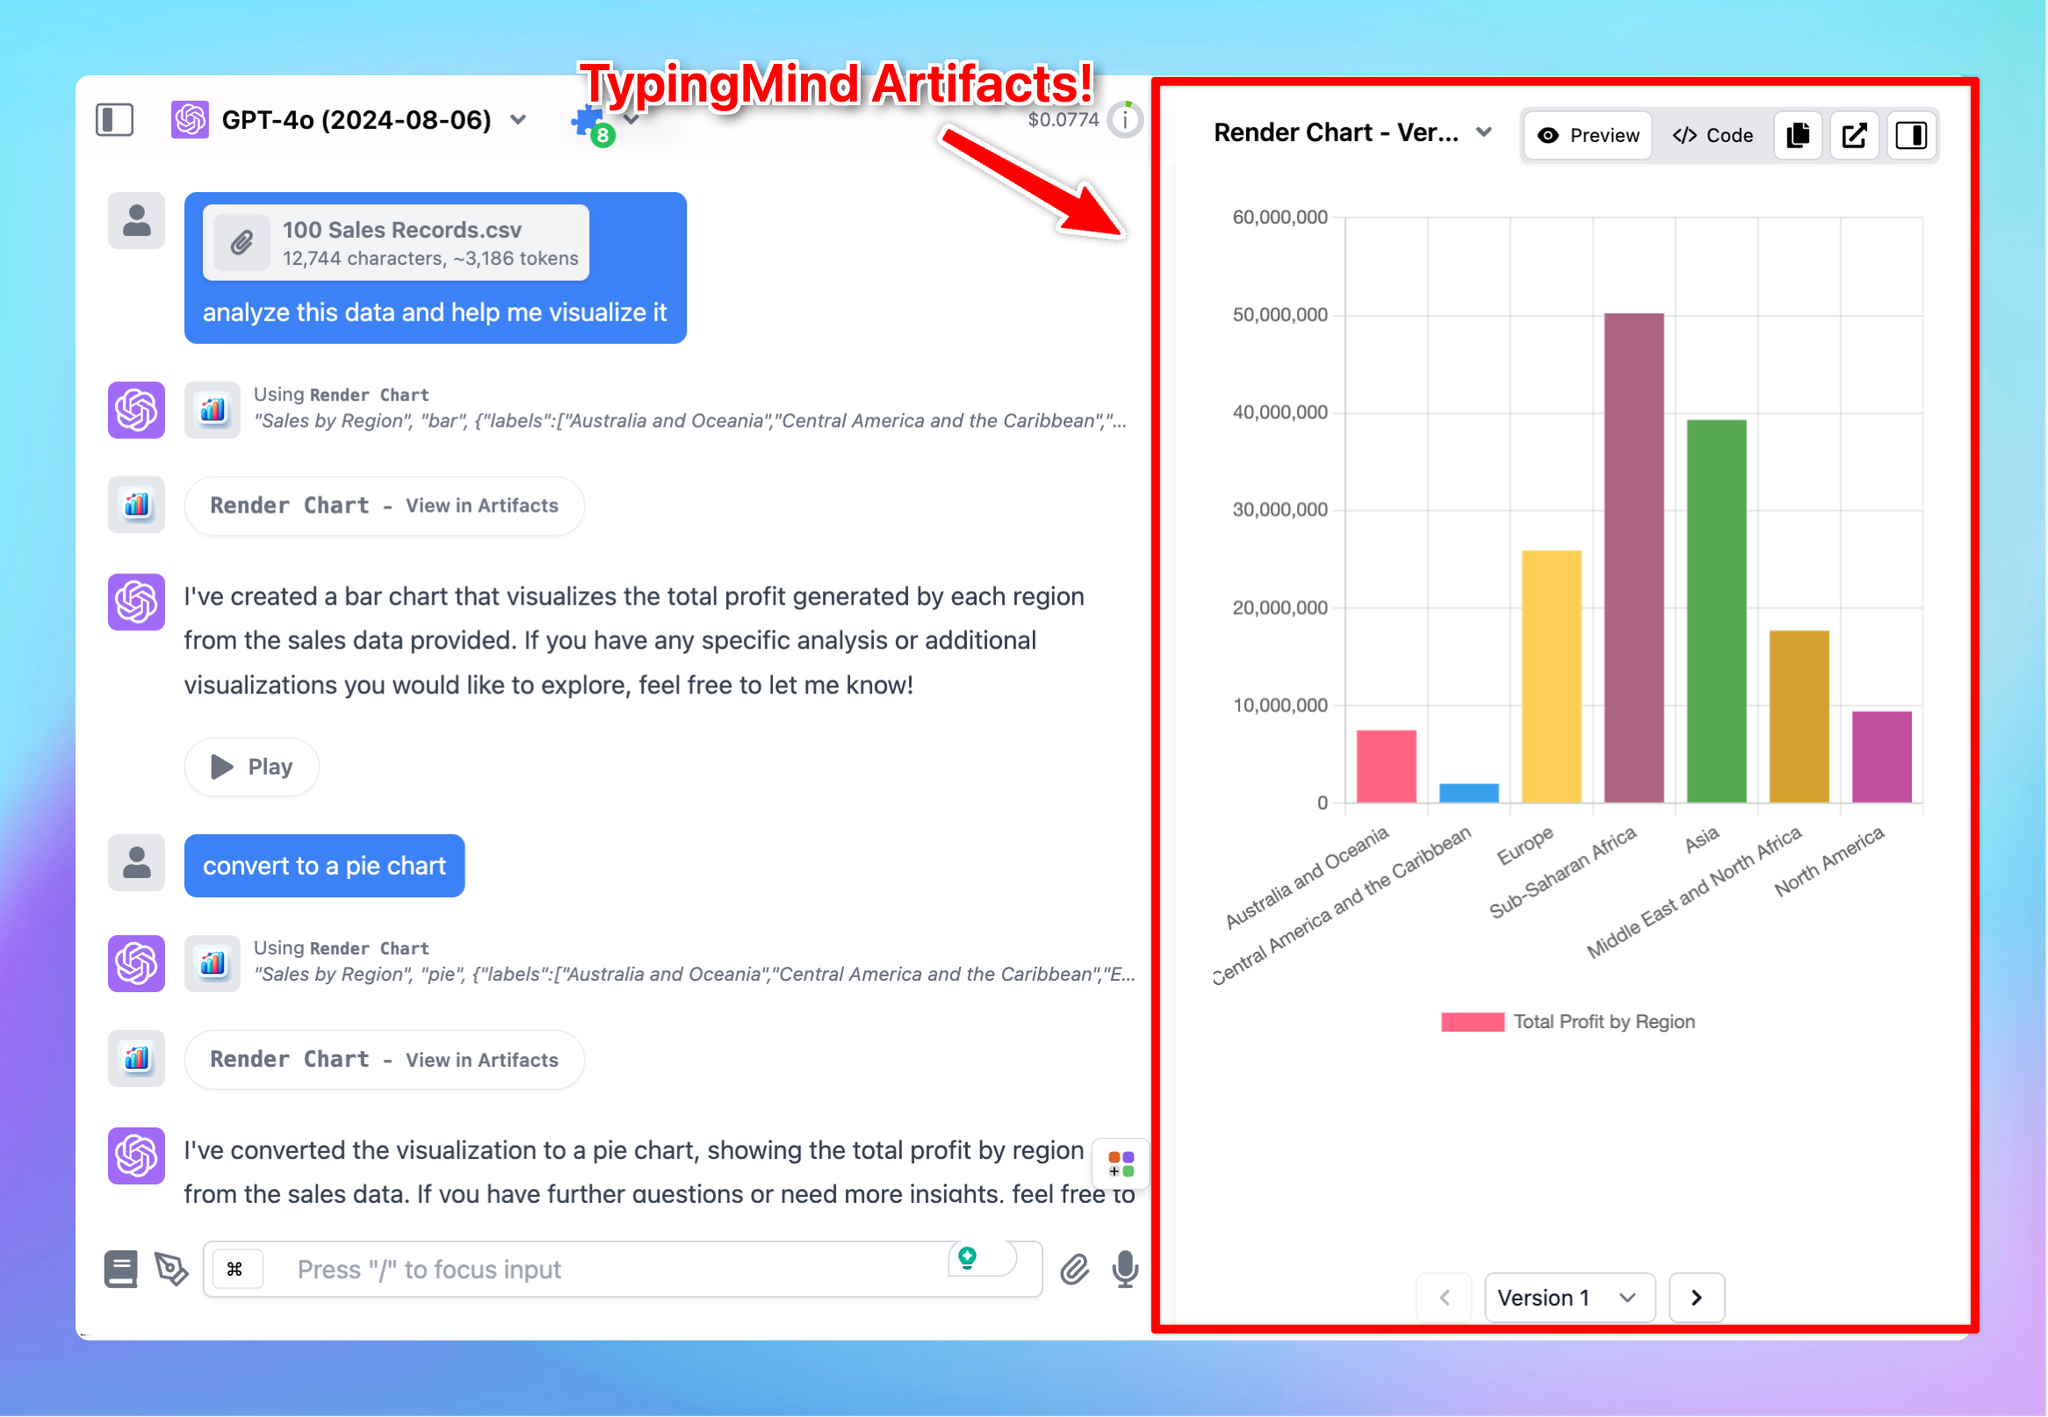
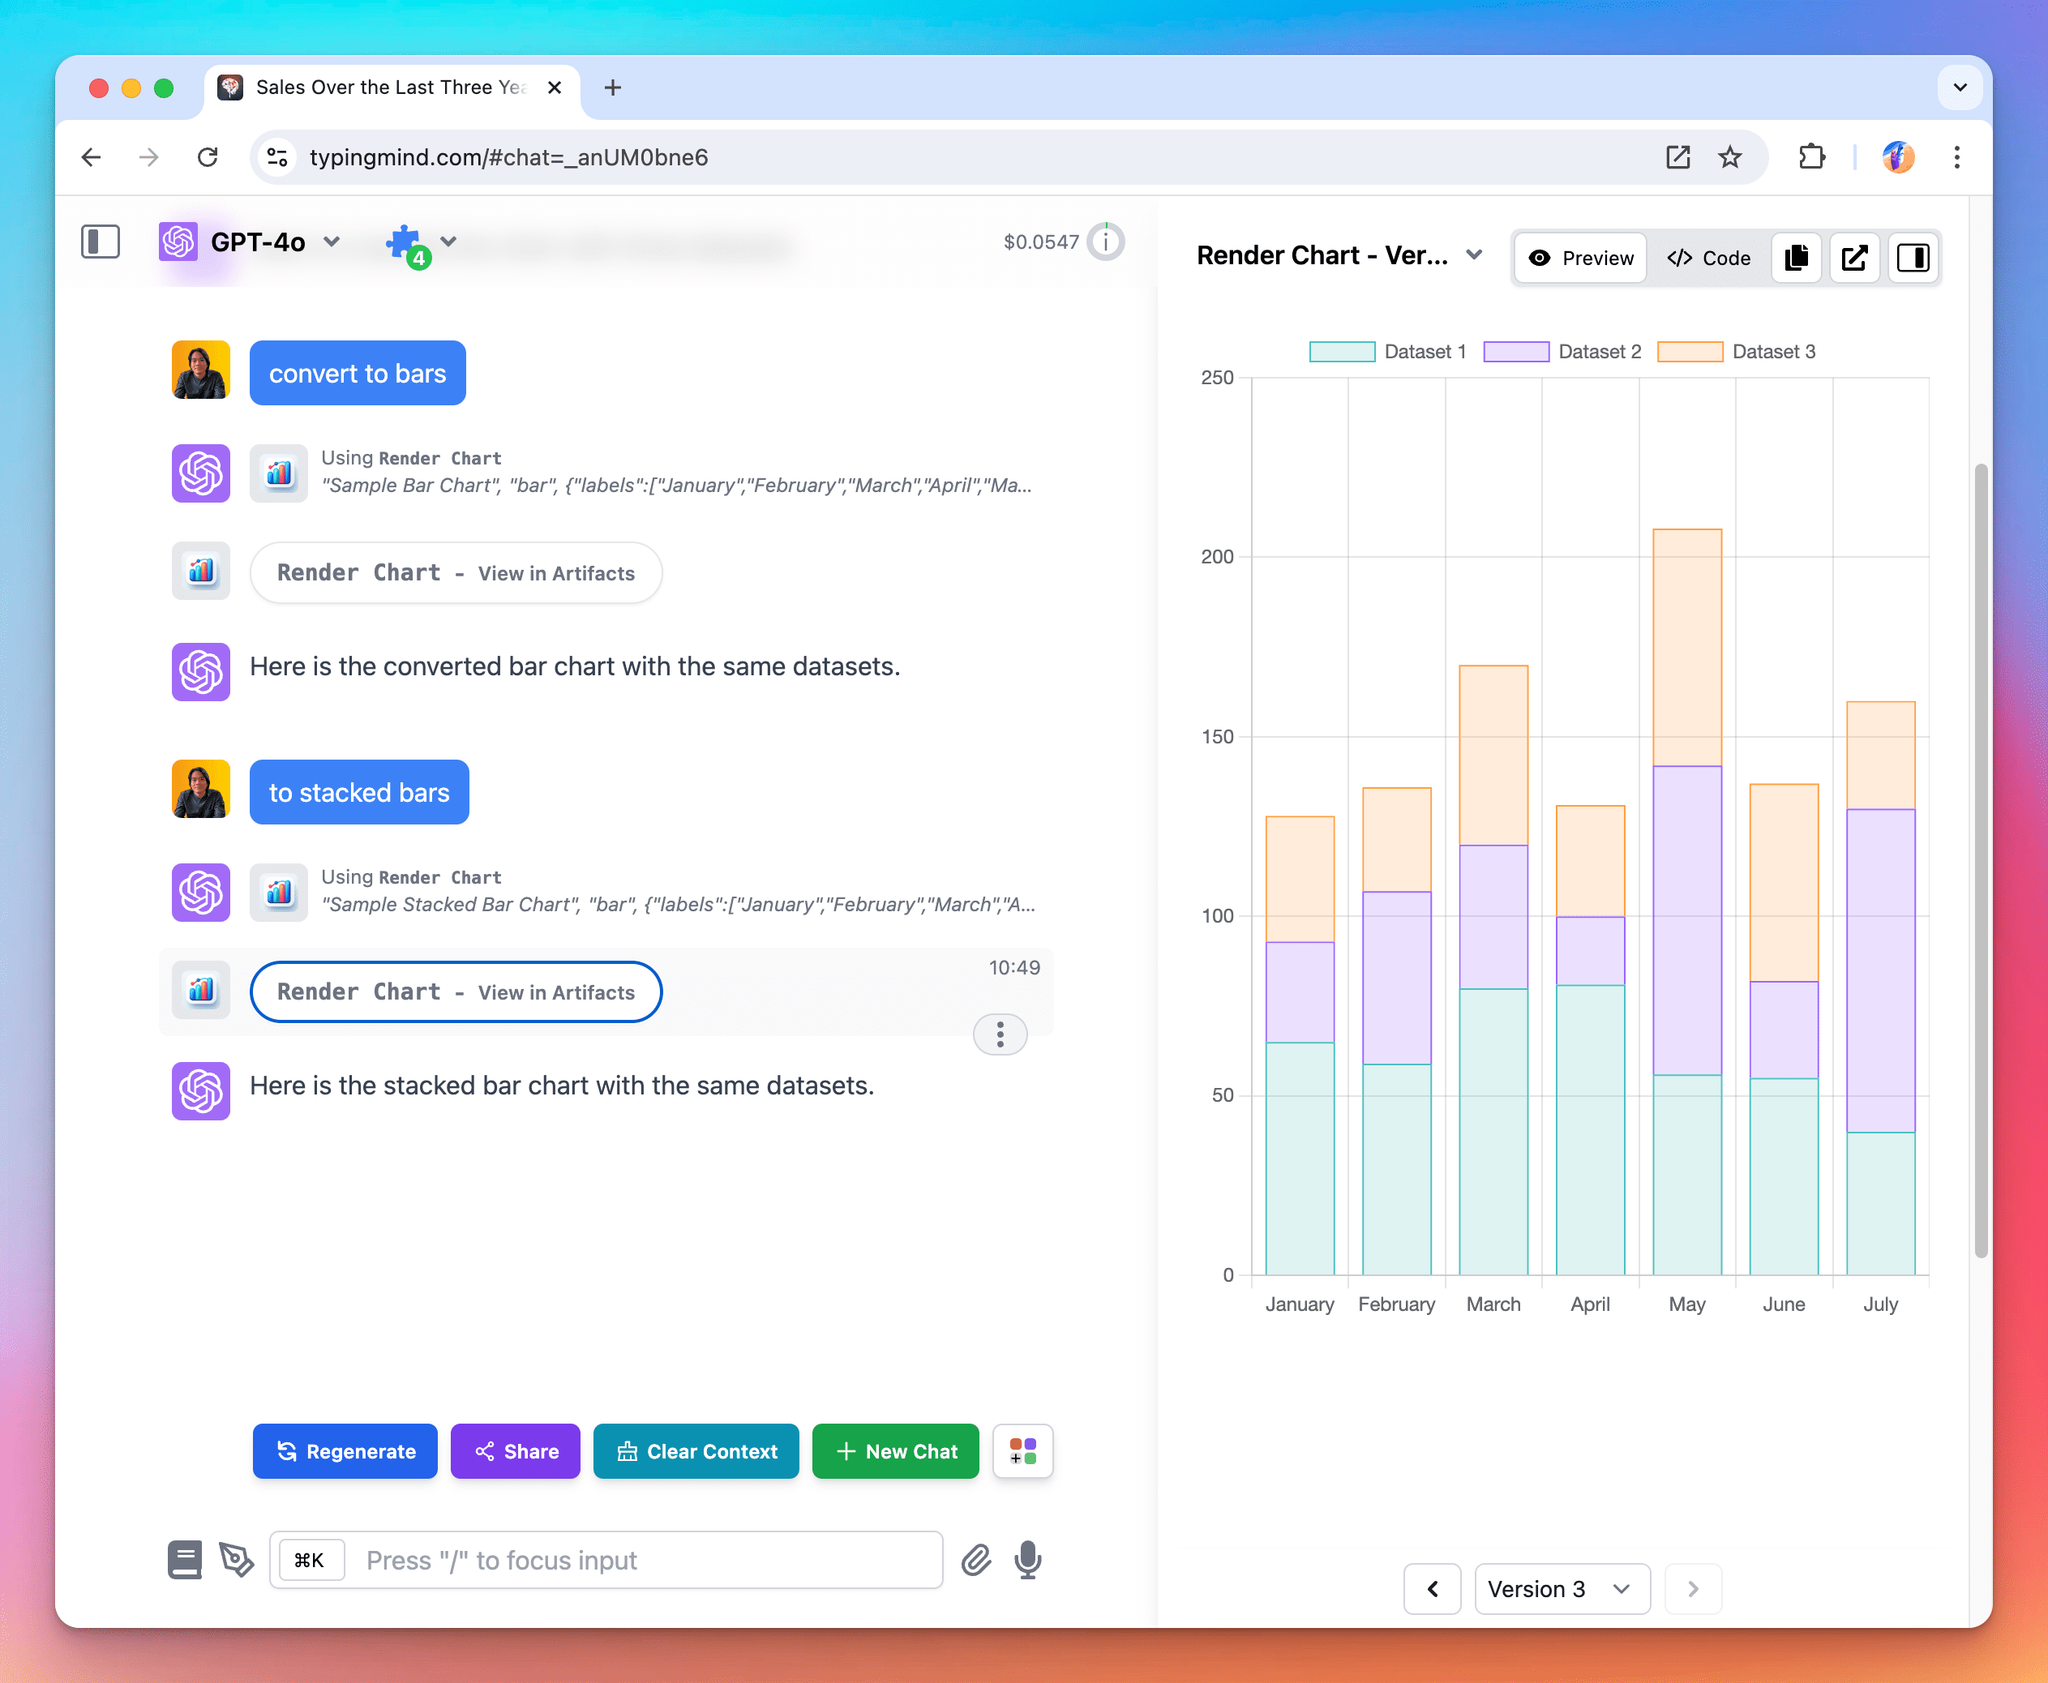
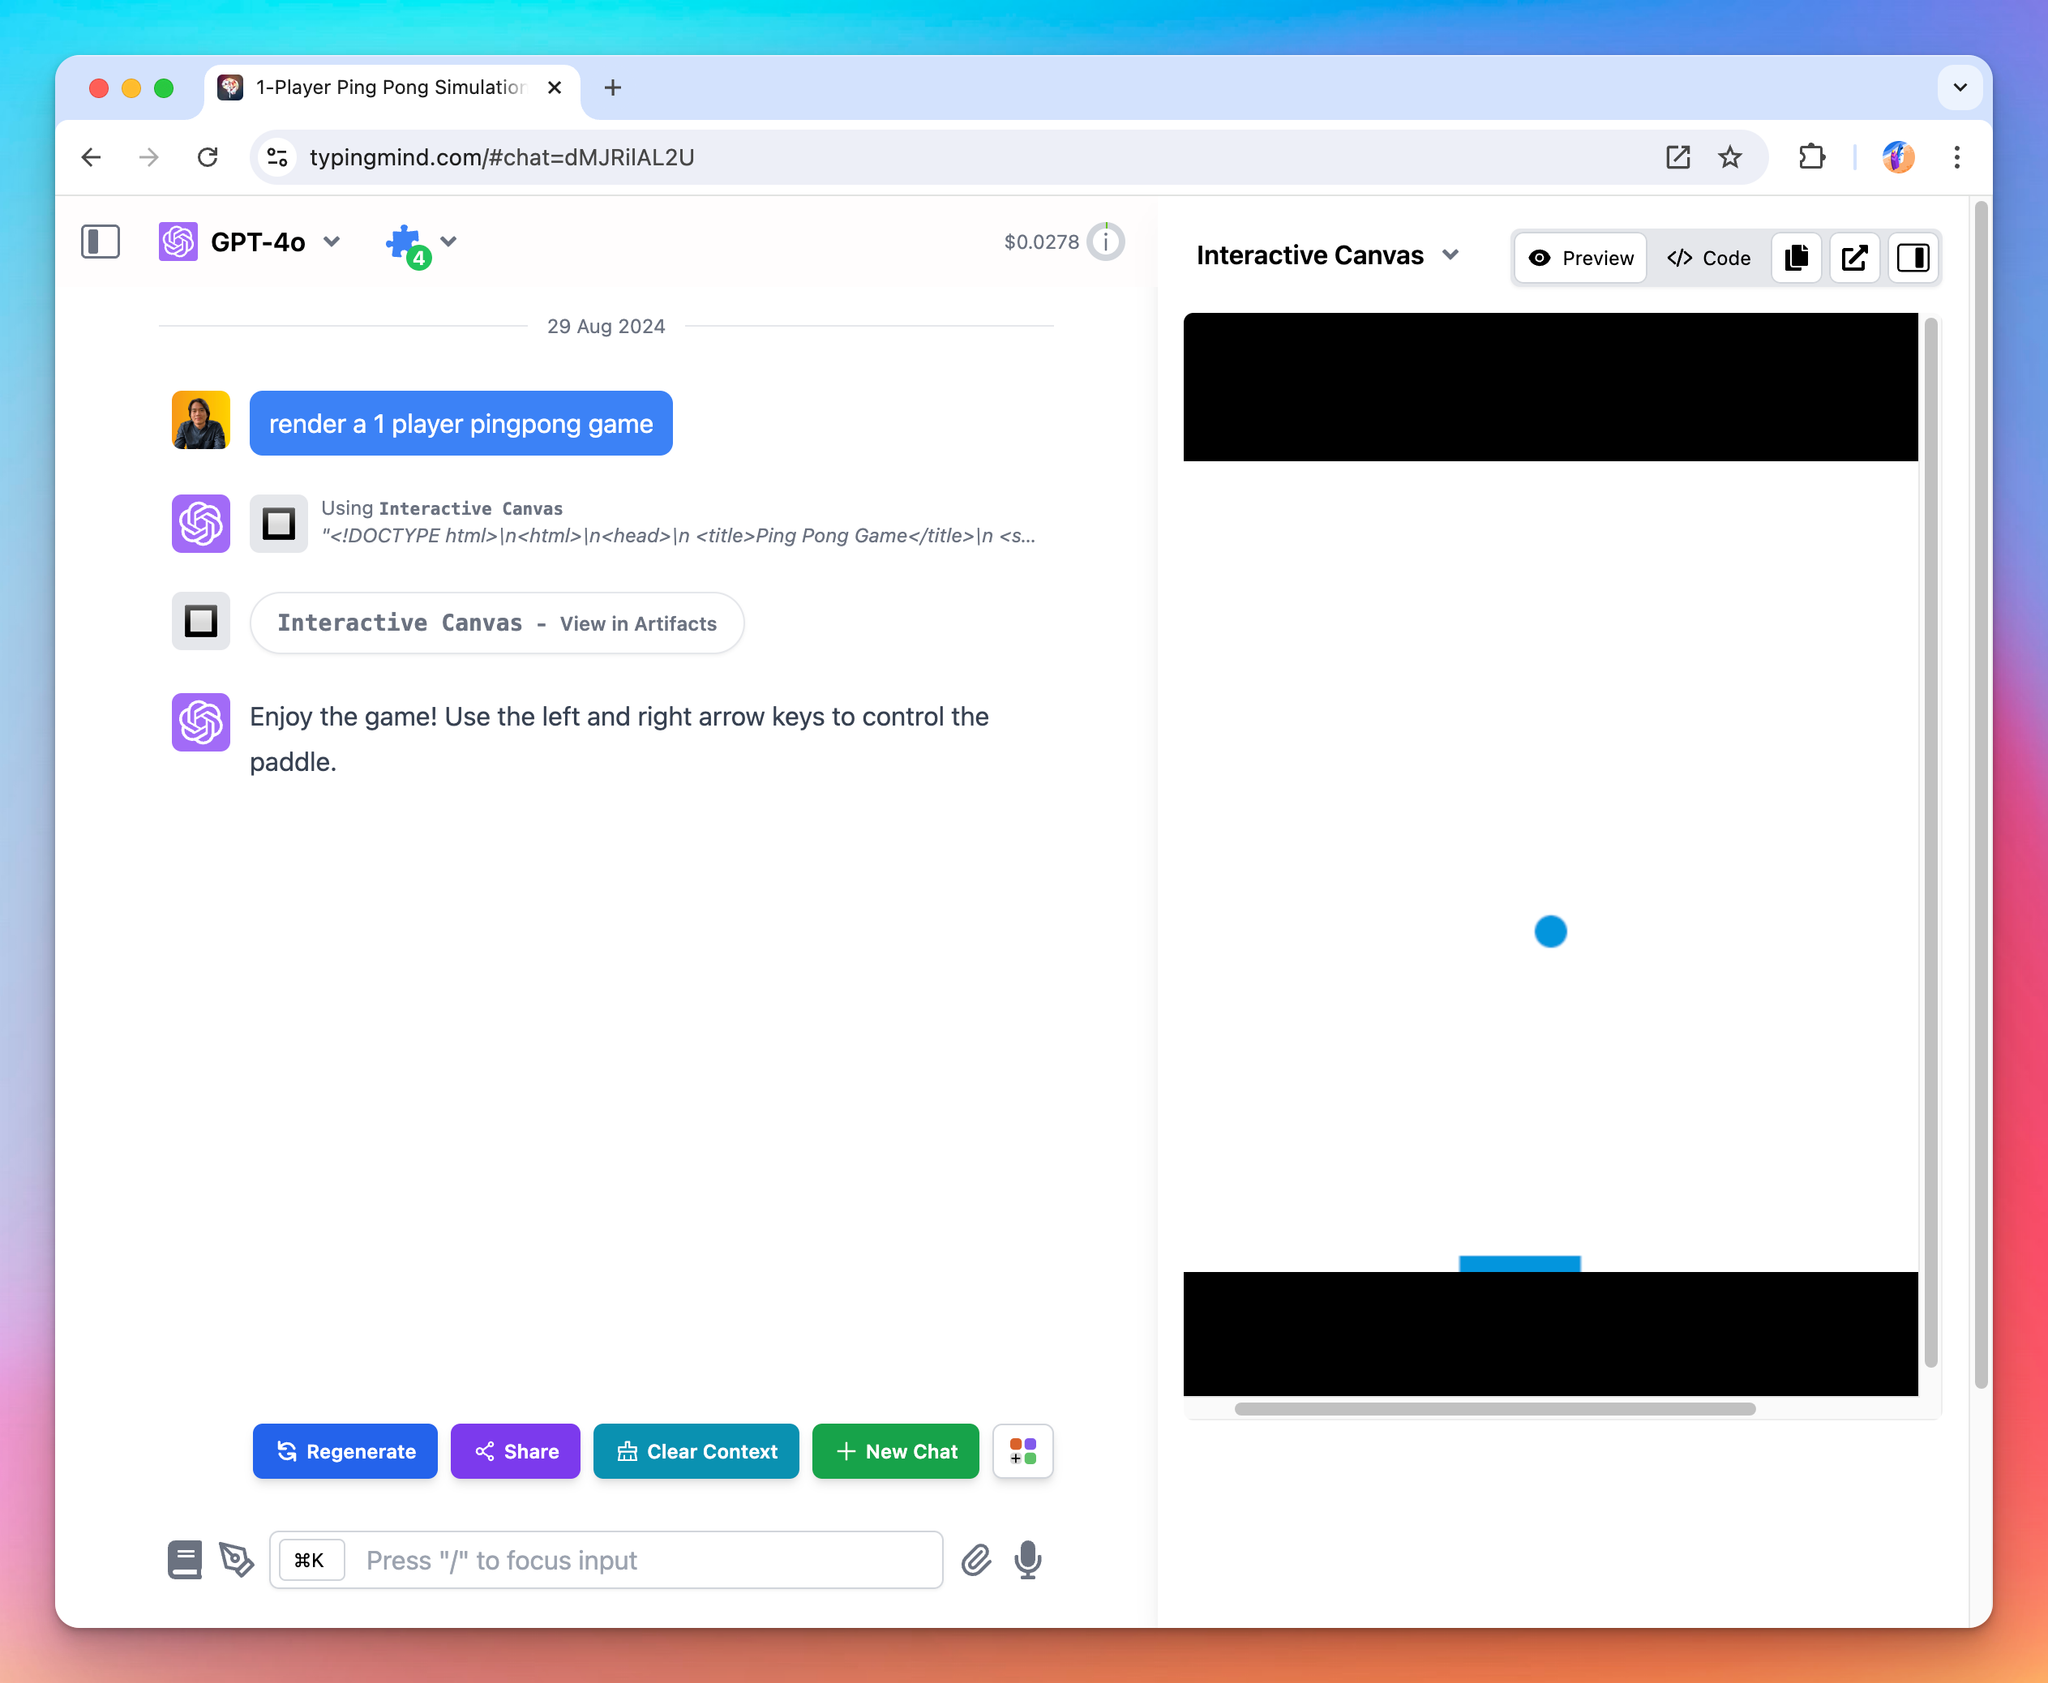
TypingMind Artifacts aims to streamline user workflow by visualizing your work in the fully formatted results in real-time and side-by-side with your conversation.
Let’s see how it works!

What is TypingMind Artifacts?
TypingMind Artifacts serves as a dedicated workspace within the app interface where complex, structured outputs such as code snippets, documents, dashboards, and interactive prototypes can be created, edited, and viewed in real time.
Interesting part? TypingMind Artifacts are not restricted to just the Claude models - they are compatible with ANY AI MODELS that support plugins, offering unmatched flexibility.
How to Access Artifacts on TypingMind?
Artifacts in TypingMind are automatically triggered when you prompt the AI model to generate specific types of content that require structured display or interaction, such as code snippets, documents, or data visualizations.
There’s no need to manually start an Artifact; it appears automatically when the context calls for it.
The AI model will automatically deploy the appropriate plugins, such as Interactive Canvas, Render Charts, or Mermaid Diagram, to help generate the visual elements you need.
Use Cases for TypingMind Artifacts
TypingMind Artifacts are designed to support a wide range of applications, making them ideal for:
- Interactive dashboards: create interactive data visualizations that update as you work

- Software or website development: developers can manage and refine code within an Artifact to build and enhance your projects.

- Create an interactive game: develop and tweak your interactive games using Artifacts.

Best Practices
Since the AI model relies on your prompt to trigger the appropriate plugin for Artifacts, it's essential that the prompt should be crafted well:
- Clearly define your objectives.
- Provide detailed instructions to the AI model.
- Include specific keywords if the AI model doesn’t automatically trigger the correct plugin. For example, use “Visualize my sales data using Render Chart”.
