- Active users
- Messages
- Conversations
- Estimated token usage
- Character usage
- Usage by users
- Usage by models
- Usage by AI Agents
Open Analytics
Go to your Admin Panel → under the Reporting section, click on Analytics. The Analytics page includes two main tabs:- Overview: view the overall usage summary and key charts.
- Exploration: create custom reports by selecting metrics, users, groups, and date ranges.
Overview
1. General metrics
The Overview tab gives you a quick summary of chatbot usage in your workspace.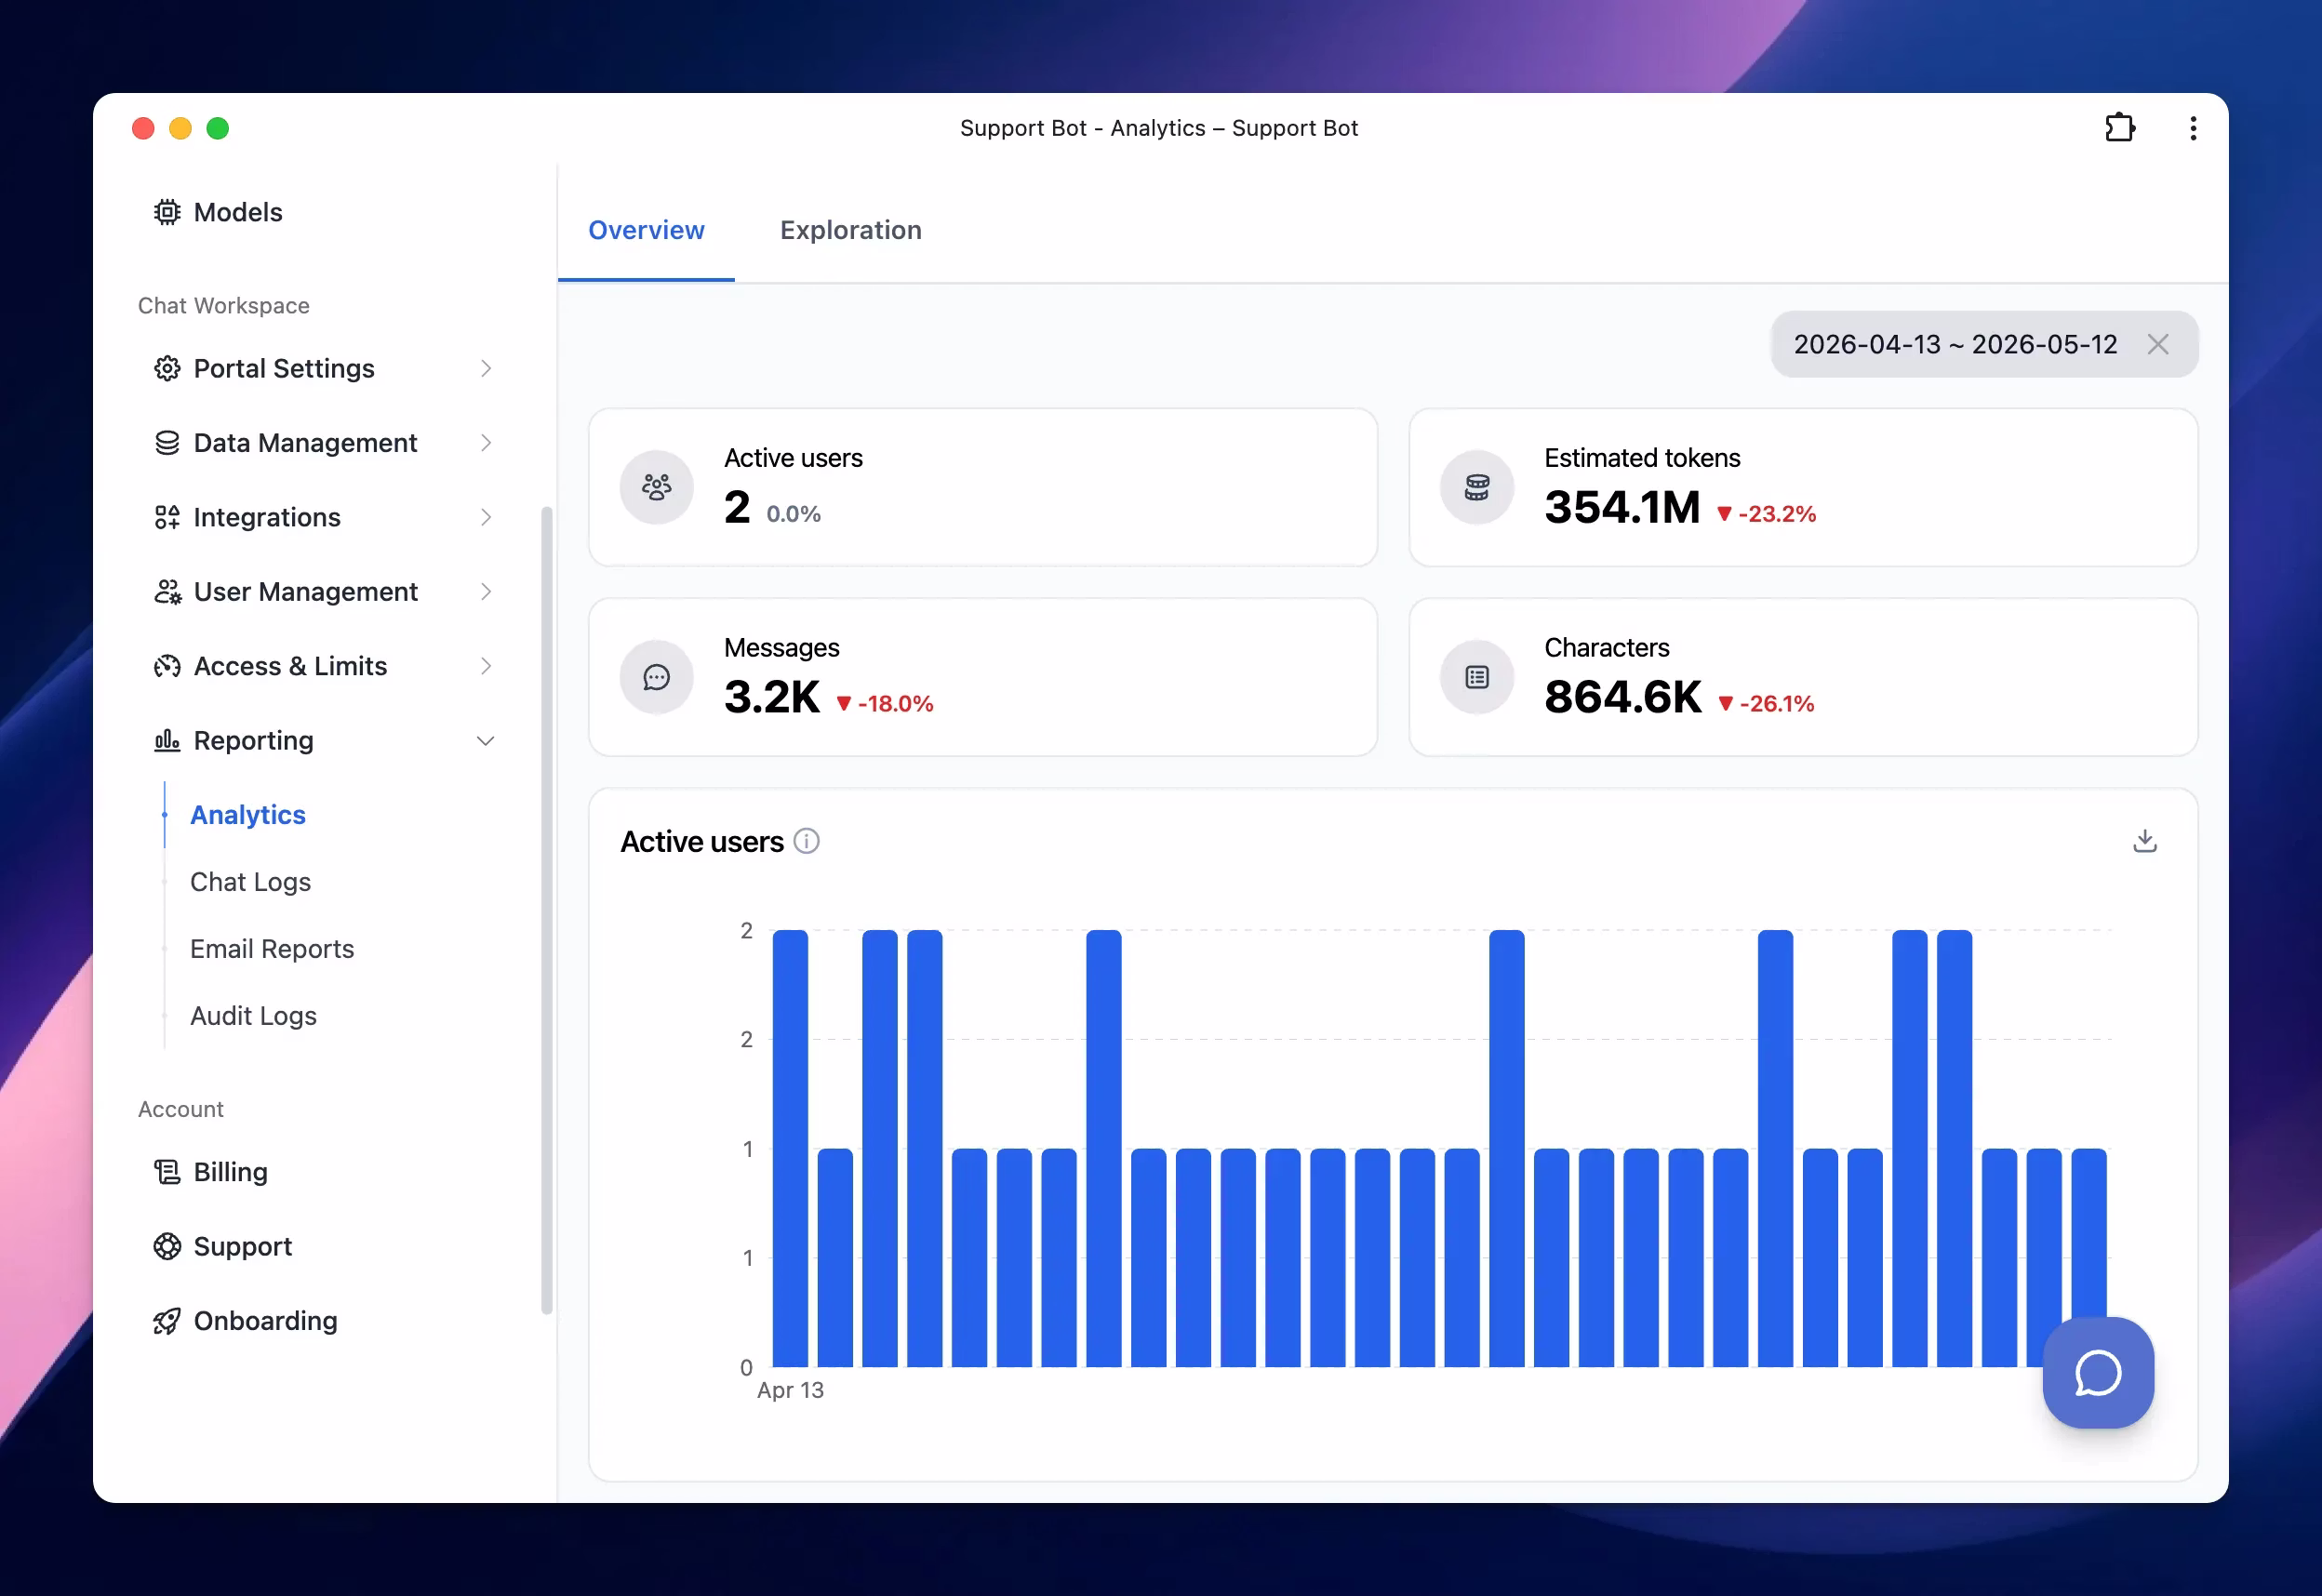
- Active users: the number of users who used the chatbot during the selected period.
- Estimated tokens: the estimated number of tokens used.
- Messages: the total number of messages sent.
- Characters: the total number of characters used.
- Active users over time
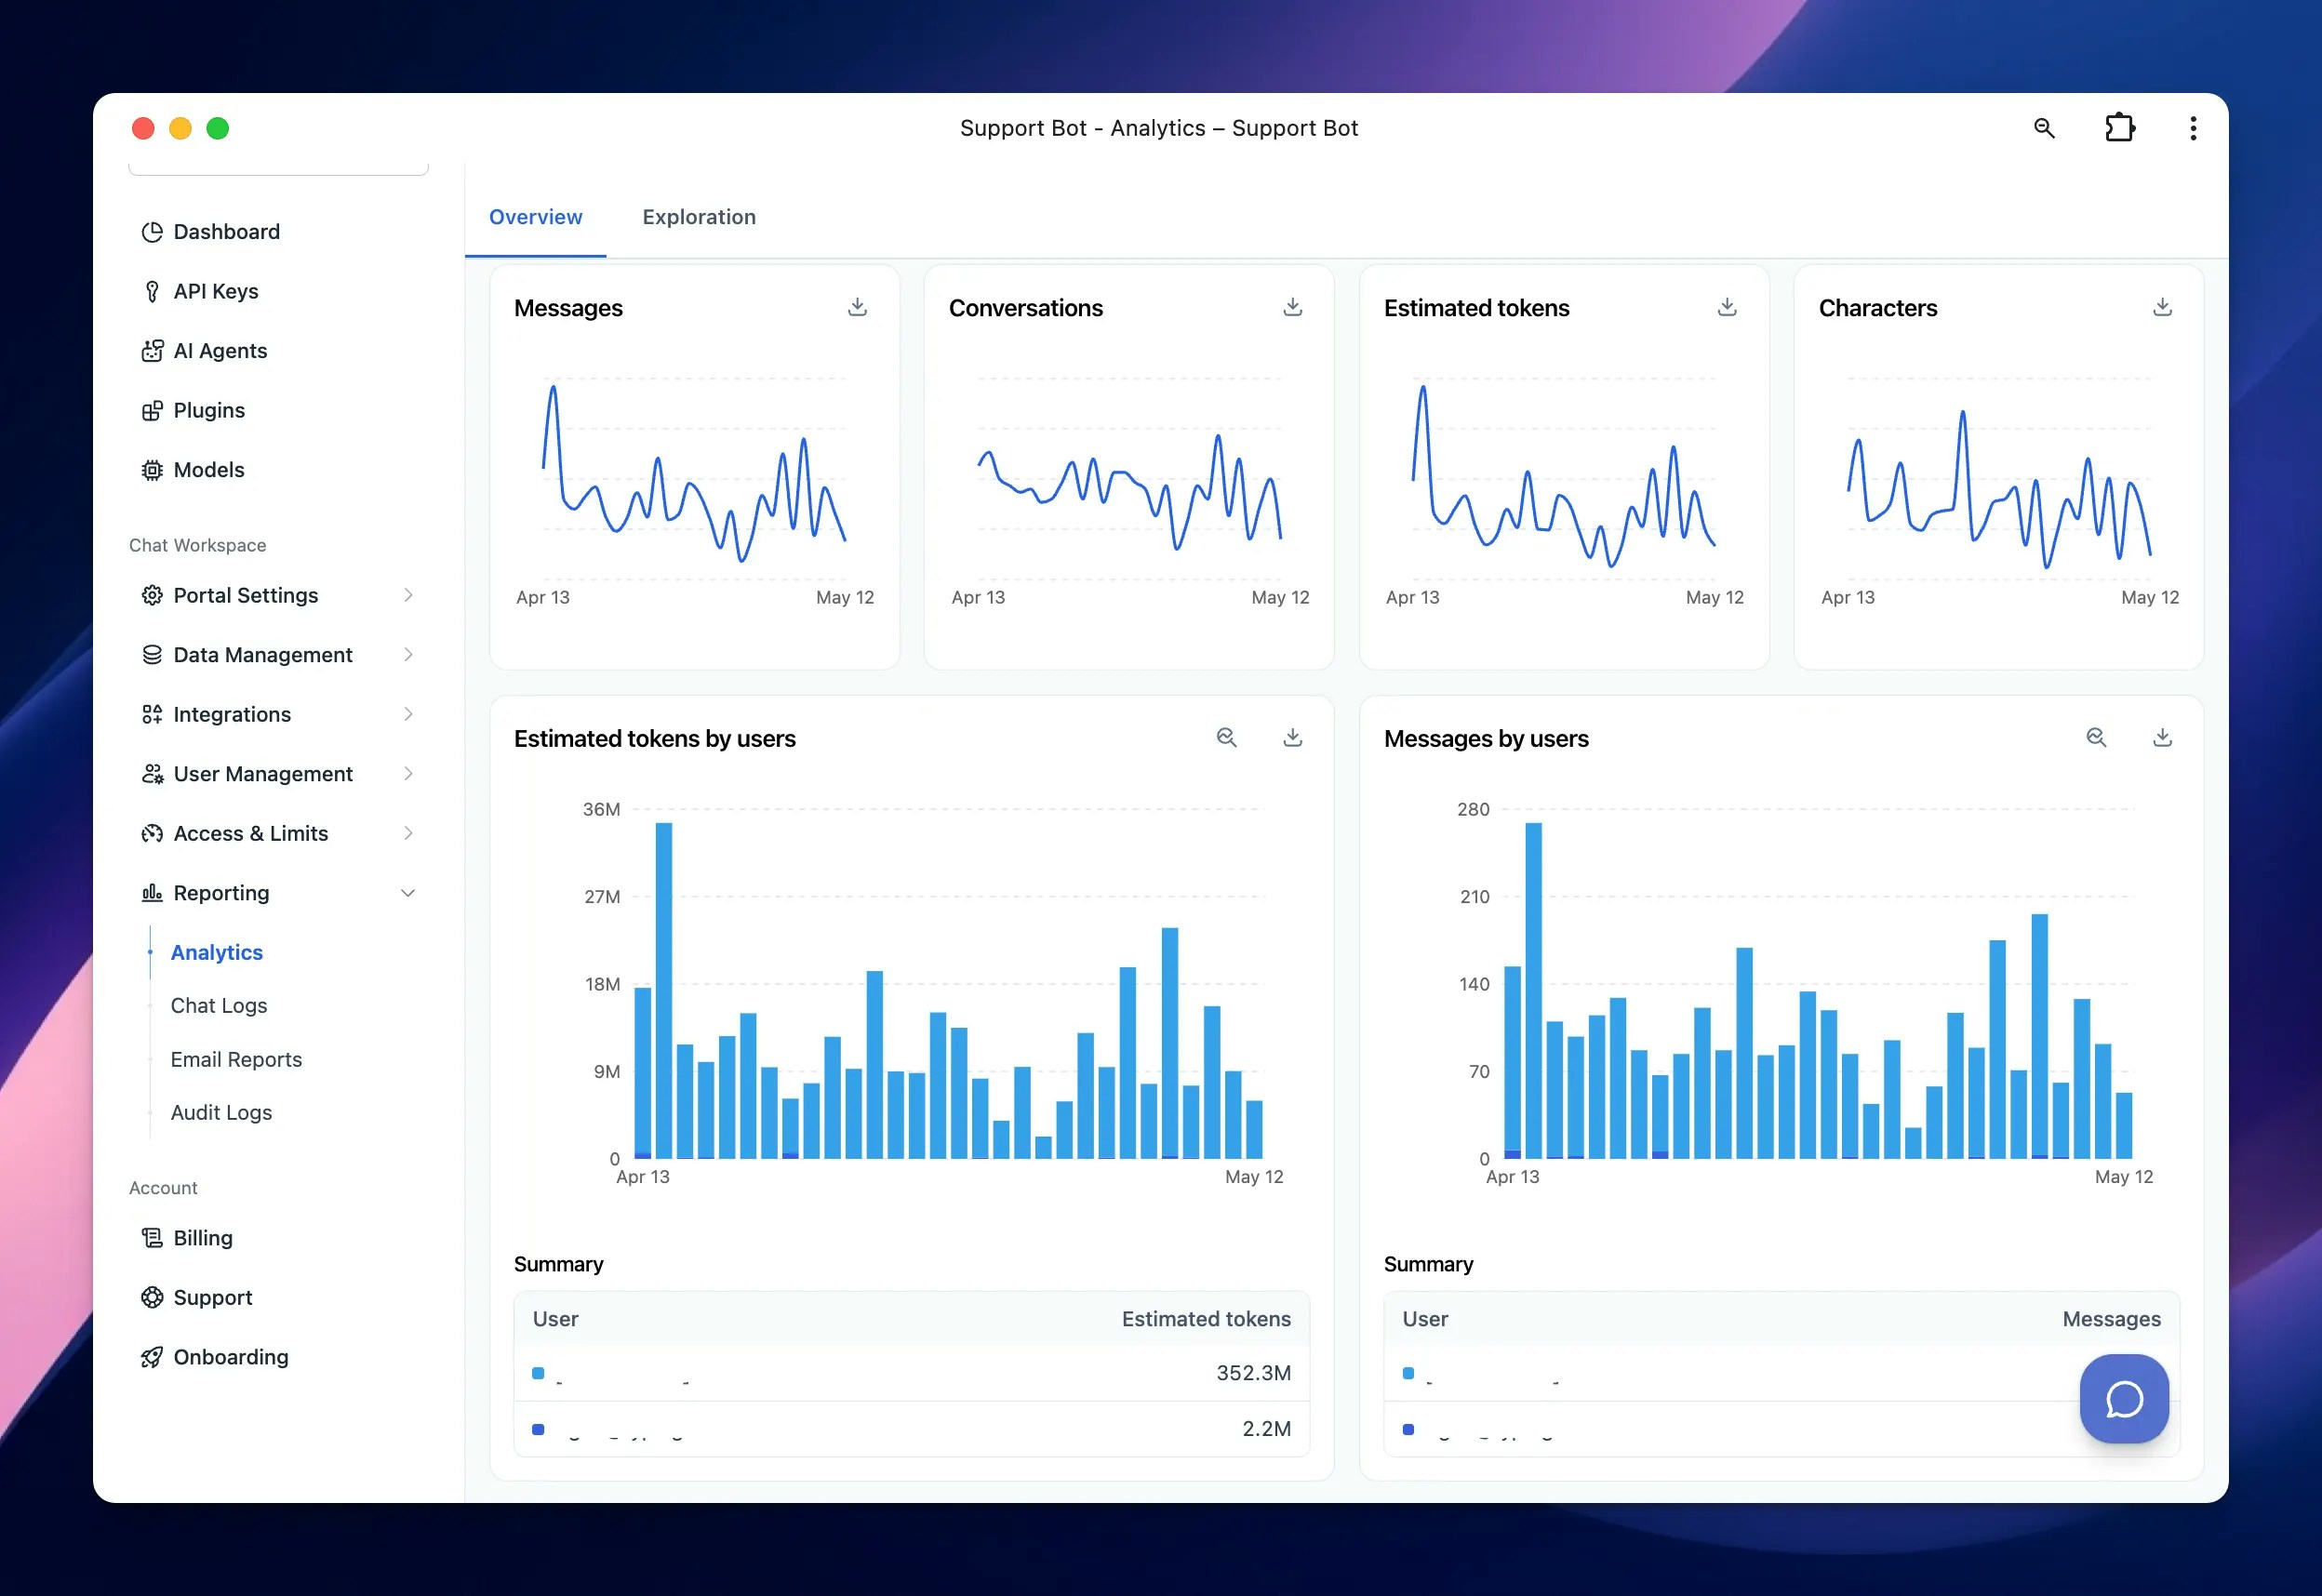
- Messages over time
- Conversations over time
- Estimated tokens over time
- Characters over time
2. Usage breakdowns
Analytics provides several breakdown charts to help you understand usage from different angles. You can review usage by:- Users: Use user-based charts to understand which users or user groups generate the most activity. Available user breakdowns include:
- Estimated tokens by users
- Messages by users
- Models: Use model-based charts to understand which AI models are used the most. Available model breakdown includes estimated tokens by models
- AI Agents: Use AI Agent-based charts to understand which AI Agents are used most often. Available AI Agent breakdowns include: Messages by AI Agents
Exploration
The Exploration tab lets you analyze usage data in more detail.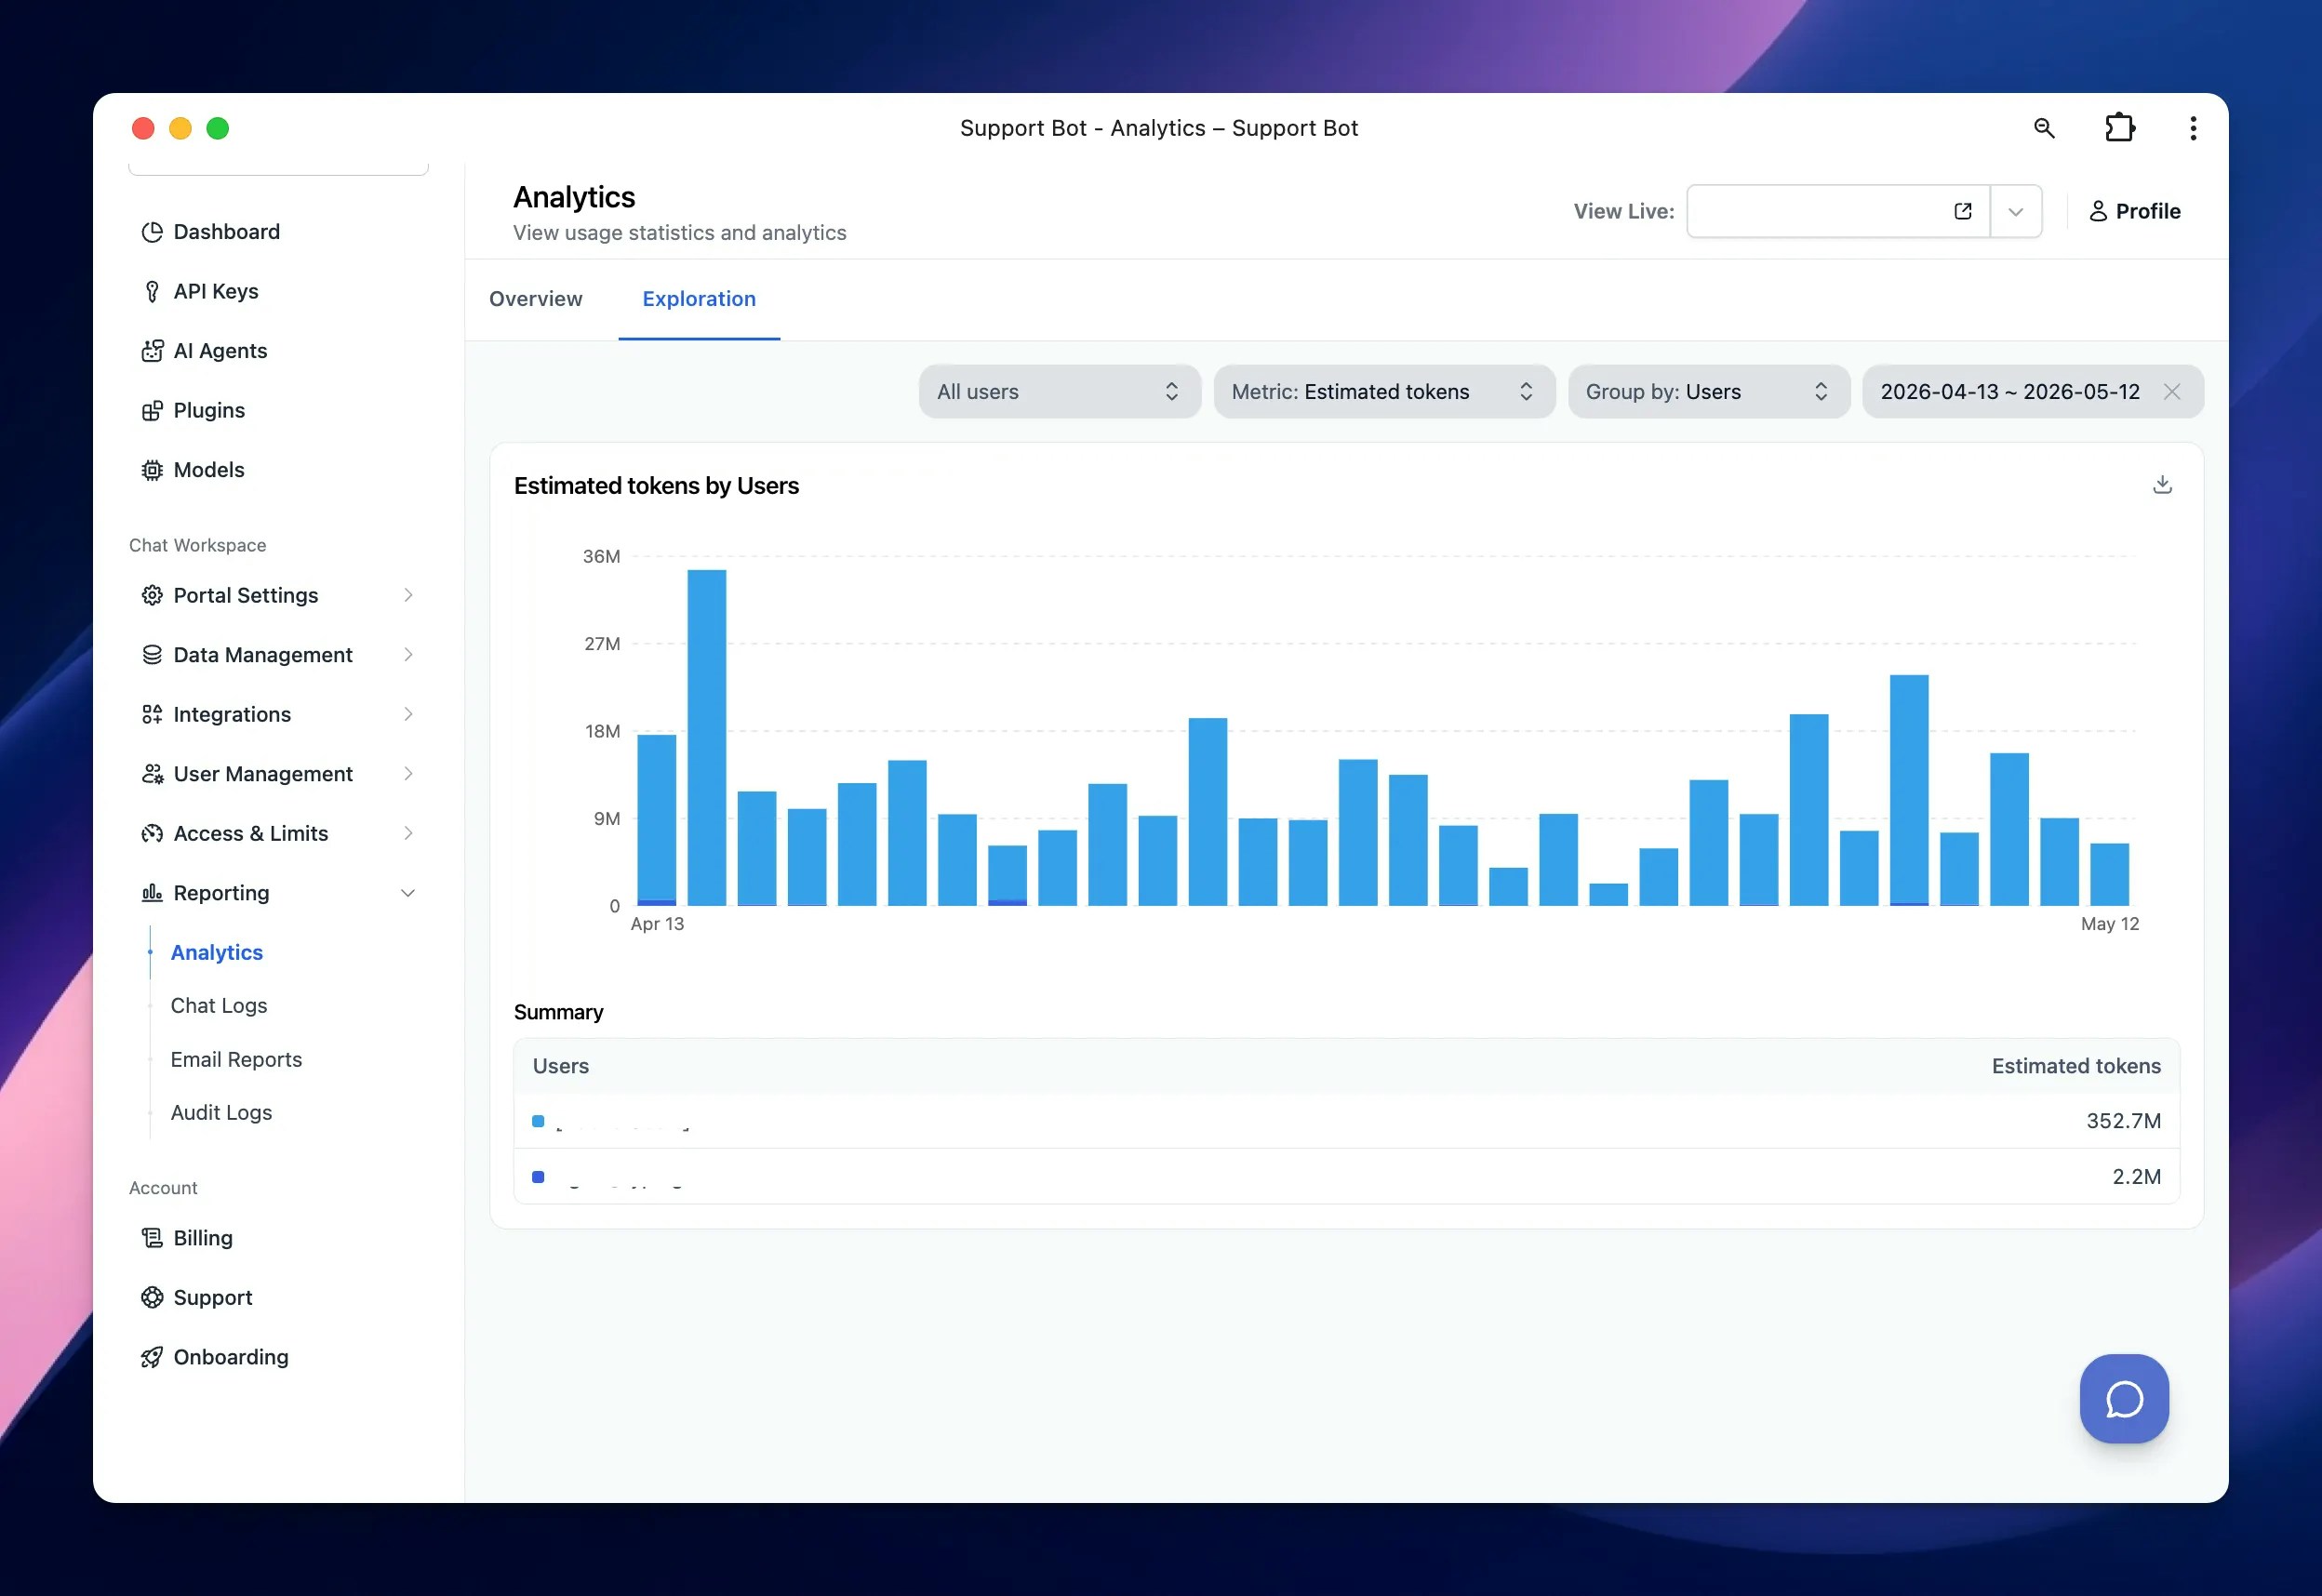
- Users: view data for all users or filter by specific users.
- Metric: choose the usage metric you want to review, including Messages, Conversations, Estimated tokens, Characters
- Group by: group the data by users, models, or AI Agents.
- Date range: select the time period you want to analyze.
- Characters by users
- Messages by models
- Estimated tokens by AI Agents
Download analytics data
Some charts include a download icon. You can use this option to export chart data for further analysis or reporting.User chat history / Chat logs
TypingMind Team also allows admins to review user chat history through chat logs. Chat logs help you understand how users interact with your chatbot and AI Agents. By reviewing chat history, you can identify common questions, detect incorrect responses, and improve the chatbot experience. You can use chat logs to:- Review conversations between users and AI Agents
- Understand what users are asking
- Identify missing or outdated knowledge
- Detect incorrect or incomplete AI responses
- Improve AI Agent instructions
- Update training data or knowledge base content
- Monitor chatbot quality and user experience